7 Classification II
Week 7 was a continuation of classification techniques taught in week 6, applicable to remote sensing and beyond.

7.1 Summary
7.1.1 Accuracy Assessment
The performance of classification techniques can be identified using accuracy assessment techniques. The resultant accuracy measure is dependent on several factors, including:
- Choice of classification technique.
- Quality of input data
- Accuracy of real data (ground truth)
The results of the classification (predicted) values are compared against the real-world (ground truth) data in an error matrix. This compares the quantity of correct and incorrect (misclassification) classifications. An example of which can be seen in Figure 7.1.

Accuracy can then be broken down into:
- Producer’s Accuracy: The percentage of correctly defined samples within a classification compared to the ground truth.
- User’s Accuracy: The percentage of correctly defined samples compared to other classifications.
- Overall Accuracy: The percentage of all correctly defined samples.
Accuracy is required to ensure the usefulness of classification results in remote sensing applications, as inaccurate models may make decision-makers uninformed. It is important to identify a suitable balance between the accuracy measures, as focusing on one may lead to placing too much importance on identifying unusual classes at the cost of overall accuracy.
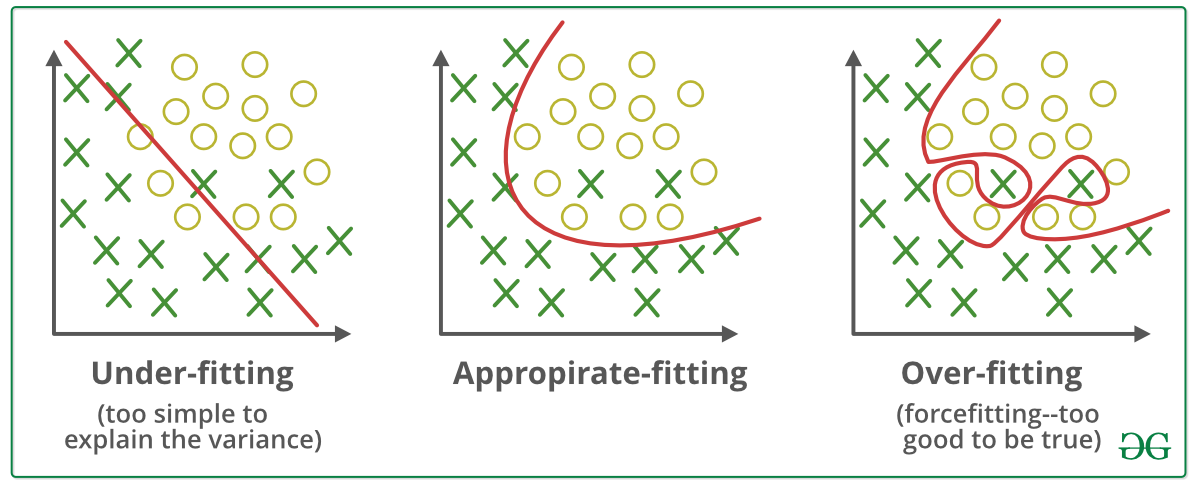
This is related to a phenomenon known as overfitting (demonstrated in Figure 7.2). This leads to high performance in training datasets, but otherwise, it performs poorly. This means that the model has learned the noise of the dataset, rather than the general trends occurring.
7.1.2 Receiver Operating Characteristic (ROC) Curve
This is a graphical representation of classification model performance showing the relationship between True and False positive rates (TPR & FPR). The ROC curve maps a perfect classifier against the TPR and FPR values to allow simultaneous evaluation of multiple classification models, as can be seen in Figure 7.3.

7.1.3 Spatial Cross Validaiton
Spatial cross-validation is a technique used to account for Tobler’s first law of geography (spatial autocorrelation) and ensure assumptions of validation techniques are maintained, particularly referencing the independence of data.
The method can be seen in Figure 7.4. Nearby pixels are not considered due to their increased likelihood to be similar (possibly biasing the model). The data is iteratively partitioned into training sets allowing validation data to be spatially independent, which is crucial for assessing the model’s accuracy.

7.2 Application
Another (in addition to week 6) application of classification is using remote sensing data to map fire severity in south-eastern Australia. Gibson et al. (2020) used a random forest approach with Sentinel 2 imagery to compare reflectance and fractional cover candidate severity indices. Cross-validation was undertaken to evaluate the mapping accuracy across the study area, revealing >95% accuracy for unburnt and extreme severity classes, with a drop off to 70% for moderate classes. The authors suggest that further study is required to improve the classification accuracy of low and moderate-severity classes and apply the RF algorithm to hazard-reduction fires.
However, again the study lacks a comparison to existing fire severity mapping methods in addition to only features only sources of satellite imagery. To mitigate these research credibility risks the author should consider comparing with other data sources to evaluate the relative benefits and weaknesses of the current model, and where possible even integrate further data sources such as thermal imagery.
7.3 Reflection
This week’s content presented a comprehensive set of techniques for assessing the accuracy, and mitigating for conditions of those tests to be met (data independence). It was interesting to learn just how powerful classification techniques can be when paired with remote-sensing data, with the valuable information to be had regarding patterns and characteristics of planetary surfaces. However, to produce reliable and accurate classifications it is important not to blindly apply them to data. To do this one must understand both the strengths and weaknesses of each technique and choose accordingly based on the specific application. This can then be reaffirmed when validation of accuracy is produced. This process allows for continuous thought and reflection on the meaning results may have, and what the researcher is expecting as an output.