5 Google Earth Engine
Week 5 focused on introducing methodologies for conducting research within the Google Earth Engine (GEE) platform.
5.1 Summary
Google earth engine is an open-access platform for remote sensing and earth observation data, providing an extensive bank of satellite imagery for analysis and visualization, allowing users to make use of Google’s computing resources to process computationally expensive tasks.
Users can interact with the platform in two ways:
- Google Earth Engine Website
- Python/ R API
However, the naming conventions are not consistent across each platform. See Table 5.1 for clarification.
| Google Earth Engine Terminology | Python Terminology |
|---|---|
| Image Collection | Raster Stack |
| Image | Raster Layer |
| Feature Collection | Vector DataFrame |
| Geometry | Geopandas Objects |
| ee.Array | Numpy Array |
| ee.List | List |
| ee.Dictionary | Dictionary |
| ee.Reducer | reduce() function |
| ee.Filter | filter() function |
5.1.1 GEE Functions
5.1.1.1 Spatial operations
Joins
- Remotely sensed imagery that intersects can be joined. This can be concurrent images through time, or images adjacent in space.
Zonal Statistics
- Computing summaries of data within a spatial area (e.g. polygon)
Filtering of images
- Applying an operation to each pixel allows the reduction of image noise or the preparation of data for further analysis.
5.1.1.2 Image reduction
Image reduction summarises imagery either through time (reducing the number of images) or through space (reducing the resolution of imagery).
Reducing through time would see an aggregation of each pixel by a statistical measure, such as the mean or median.
The spatial reduction would see aggregation by region or neighbourhood, with the mean or median values being measured. This can be done either by proximity to local pixels, or a summary within a specified polygon.
5.1.1.2.1 Regression
Regression can also function as a form of image reduction, allowing the identification of change over time within a pixel.
5.2 Application
GEE has an extensive range of applications. Ghasempour, Sekertekin, and Kutoglu (2021) made use of the platform to quantify changes in atmospheric pollution experienced across Turkey during the initial COVID-19 outbreak.
Sentinel-5P provided NO2 and SO2 products to quantify the variation occurring resultant of globally implemented lockdowns. The combination of remotely sensed data and statistical tests allowed the identification of both seasonal pollution values and a 30% average national reduction during the lockdown months, as can be seen in Figure 5.1.

However, as was pointed out by Gil-Alana, Yaya, and Carmona-González (2020), air pollution research should be subject to criticism if 8 seasons of data before and after the change occurred are not considered. Ghasempour, Sekertekin, and Kutoglu (2021)’s conclusions should therefore be interpreted with caution as a strong bias may be present. If the author could provide further background into past seasonal trends of Turkey’s air quality then the conclusions would be further reinforced.
5.3 Reflection
The ability for remote sensing research to be coded in the google earth engine and its APIs provides a key opportunity for heightened reproducibility within earth observational research, as has become popular in current literature. In addition to the swiftness (owing to the analysis being performed remotely on Google’s servers), the platform appears far superior to manually downloading and then analysing remotely sensed imagery within a graphical user interface (GUI) such as SNAP or QGIS.
However, more advanced processing tools that are customised for each project (such as interferometry) are currently only present in SNAP and cannot be found within the GEE environment. Furthermore, the javascript used for GEE has its limitations:
- Not being able to run portions of the script, only having the option to run the entire script (Inefficient when developing code).
- Some functions in GEE are much longer than their counterparts in Python/ R.
Furthermore, as JavaScript is a new language to me, I have found myself relating to Figure 5.2 frequently.

Though I will continue to learn JavaScript in this context, I wonder if it would be more appropriate to have an overview of GEE and then continue to code in R/ python. I am much more confident in python and will be exploring its use of it in academic research. Though there have been some criticisms that visualisation is more difficult outside of the GEE platform.
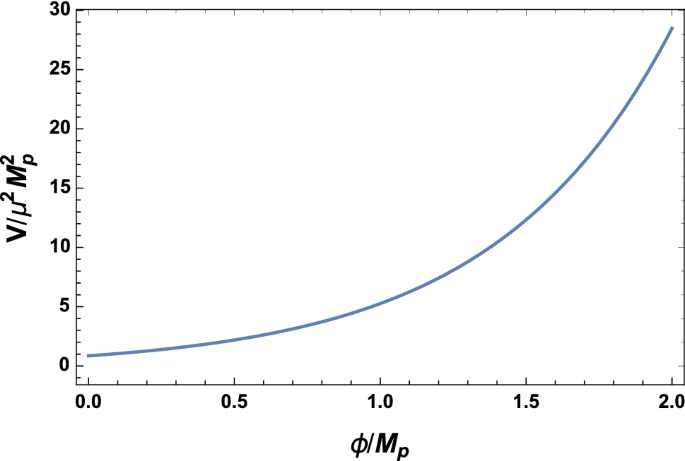
Future work: A key area that I would like to investigate is an extension of my undergraduate dissertation, looking at air pollution concentration change after the implementation of policy. If a reproducible and rigorous workflow or methodology could be established within python using data from GEE, then the larger question of “is this type of policy effective?” could be answered, instead of answering “is a policy in a specific place effective?”. It would be far easier to input a shapefile layer of administrative districts to then identify spatial and temporal trends. For example, an average gravity decay function detailing the relationship between pollution change and distance from the policy boundary could be developed to allow policymakers to make predictions of air pollution change that could be expected from implementing a vehicle restriction area. An example of a gravity decay function can be seen in Figure 5.3, distance would replace the x-axis and pollution change on the y-axis.