6 Classification I
Week 6 focused on the use of classification techniques on remotely sensed data.
6.1 Summary
Week 6 focused on the use of classification techniques within remotely sensed data, with some use cases looking at illegal logging identified by the Brazilian polices force to have a near real-time response to new bouts of activity.
The classification techniques included involve:
Linear regression
Classification and regression trees (CART)
With a specific look into the limitations such as overfitting involved.
Random forests can be used to skirt these downfalls with multiple iterations.
Another group sees unsupervised learning.
- Support Vector Machine (SVM)
However, the use of these methods should be thought over due to the resemblance to a black box.
Classification techniques are an integral stage required to efficiently process and analyse remotely sensed data, due to the sheer volume of images acquired. Pixels are grouped with their neighbours based on their spectral characteristics, allowing both spatial and temporal analysis of trends.
Supervised classification refers to the use of training a model on existing data, allowing the algorithm to learn the characteristics attributable to various land cover types. This can then be applied to unseen data accurately and reliably. However, this technique comes with a high initial cost for creating the training data.
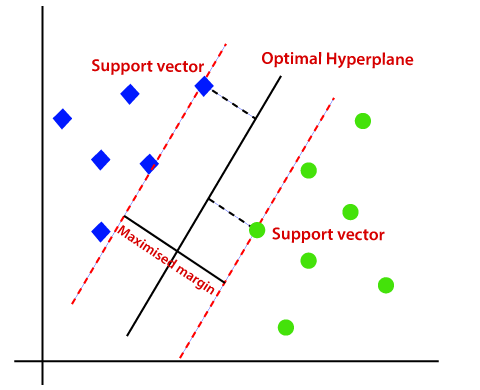
SVMs are a linear binary classification technique that separates points with a boundary, called a ‘separating hyperplane’. This identifies the largest margin between the classes, allowing increased generalisation performance across the unseen data.
Unsupervised classification, on the other hand, is an approach that can be applied when there is limited knowledge of the area of study. This is often referred to as a clustering technique, where similar spectral values are grouped. After which, are interpreted by the user. These techniques benefit from not requiring prelabeled data. However, it can often be difficult to interpret the classes, due to the black box-like nature of the model (meaning it is not clear how the classes were separated).
To conclude, the efficient identification of reliable and accurate land use and cover types through time requires the use of classification techniques. Supervised and Unsupervised learning methods will be chosen based on their relative strengths and weaknesses.
6.2 Application
In this section, one use of classification techniques in the real world is identified and relevant literature is reviewed.
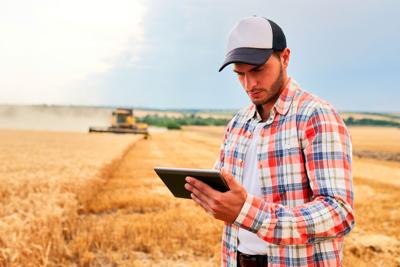
Classification techniques have a multitude of applications within remote sensing research, a key research topic being the prediction of crop yields. It provides stakeholders (farmers, academics and government officials) with an efficient and relatively accurate means to identify the yield of a field, therefore allowing informed decisions to be made. The work of both Dang et al. (2021), and Zhu, Wang, and Luo (2021) used Support Vector Regression (SVR), Random Forest Regression (RFR) and Deep Neural Networks (DNN) to explain an average of 80% of the variation within their crop yields. This suggests that classification techniques could be of use to different scale groups:
| Scale | Small Scale | Large Scale |
|---|---|---|
| Group | Farmers | Governments |
| Possible uses 1 | Access to finance: Financial institutions may provide more favourable terms on their loans with evidence of expected yields. | Improved food security: Governments can plan for food droughts by taking appropriate measures during a year of low expected crop yields. |
| Possible uses 2 | Access to finance: Financial institutions may provide more favourable terms on their loans with evidence of expected yields. | Increased tax accuracy: Government GIS departments can compare reported yields from farmers to that predicted using classification techniques. |
Though there are extensive benefits to the semi-automation of crop yield prediction using remote sensing, caution should be had before adopting this methodology. Khanal et al. (2020) noted several criticisms of this methodology, including:
- The limited spatial resolution could lead to missing key points of interest.
- Possible inaccurate sensor calibration leading to over/ underestimation of the yield
- Extensive data processing before insights can be extracted
Rojas (2007) proposed the use of ground validation to mitigate these limitations. As this would not only allow for more accurate modelling in the future but also more confidence to be had for the existing image sets.
A summary of this section can be seen in Figure 6.2.

6.3 Reflection
Classification appears a powerful option for understanding data even further. Though does bring about concerns of seeming like a ‘black box’. This refers to the complex underlying algorithms behind the classification techniques often being difficult to understand leading to the little rationale behind decisions. This proves problematic in the fields of academia and informing policy, as we need to ensure that the methods are unbiased and not discriminatory. Furthermore, if applied without sufficient prior consideration the classification models may move from the realm of data-informed/ driven decision-making to data validation. This suggests that policymakers use data to support their existing plans, which is the reverse of how decision-making would ideally be made.
Future uses: I would be interested in applying classification techniques to my past research on the impact policy has on air pollution in urban areas. Classification could provide insight into the factors not previously used to explain changes in pollution levels. This could then be implemented into regression models, or even bayesian networks to identify the probability that each factor contributes to variation in the variable of the study. Remote sensing could provide weather, and vegetation data which are both key factors that influence rates of change in pollution concentration. Classification would also be able to identify areas that could benefit from heightened intervention due to their increased risk of exposure to poor air quality.